How to Track Your Print Marketing with QR Codes
You spent $2,000 on a direct mail campaign. Five thousand postcards went out with your offer, your website, and your phone number. A few weeks later someone asks: did it work?
You don't know. You can check if website traffic went up that week, but you can't tell which visits came from the postcards versus Google versus someone's Instagram post. You can ask new customers "how did you hear about us?" but most people don't remember or don't answer honestly.
Print marketing has always had this problem. You pay to put something in front of people and then hope it works. Digital marketing has analytics baked in — clicks, impressions, conversions. Print has nothing.
Unless you add tracking yourself.

The simplest way to track print
Put a dynamic QR code on every printed piece. When someone scans it, the scan is logged — where they are, what device they're using, what time they scanned, and how many times that code has been scanned total.
That's it. No special software on their end. No app download. They scan the QR code with their phone camera like they've done a hundred times at restaurants and parking meters. But on your end, you now have data.
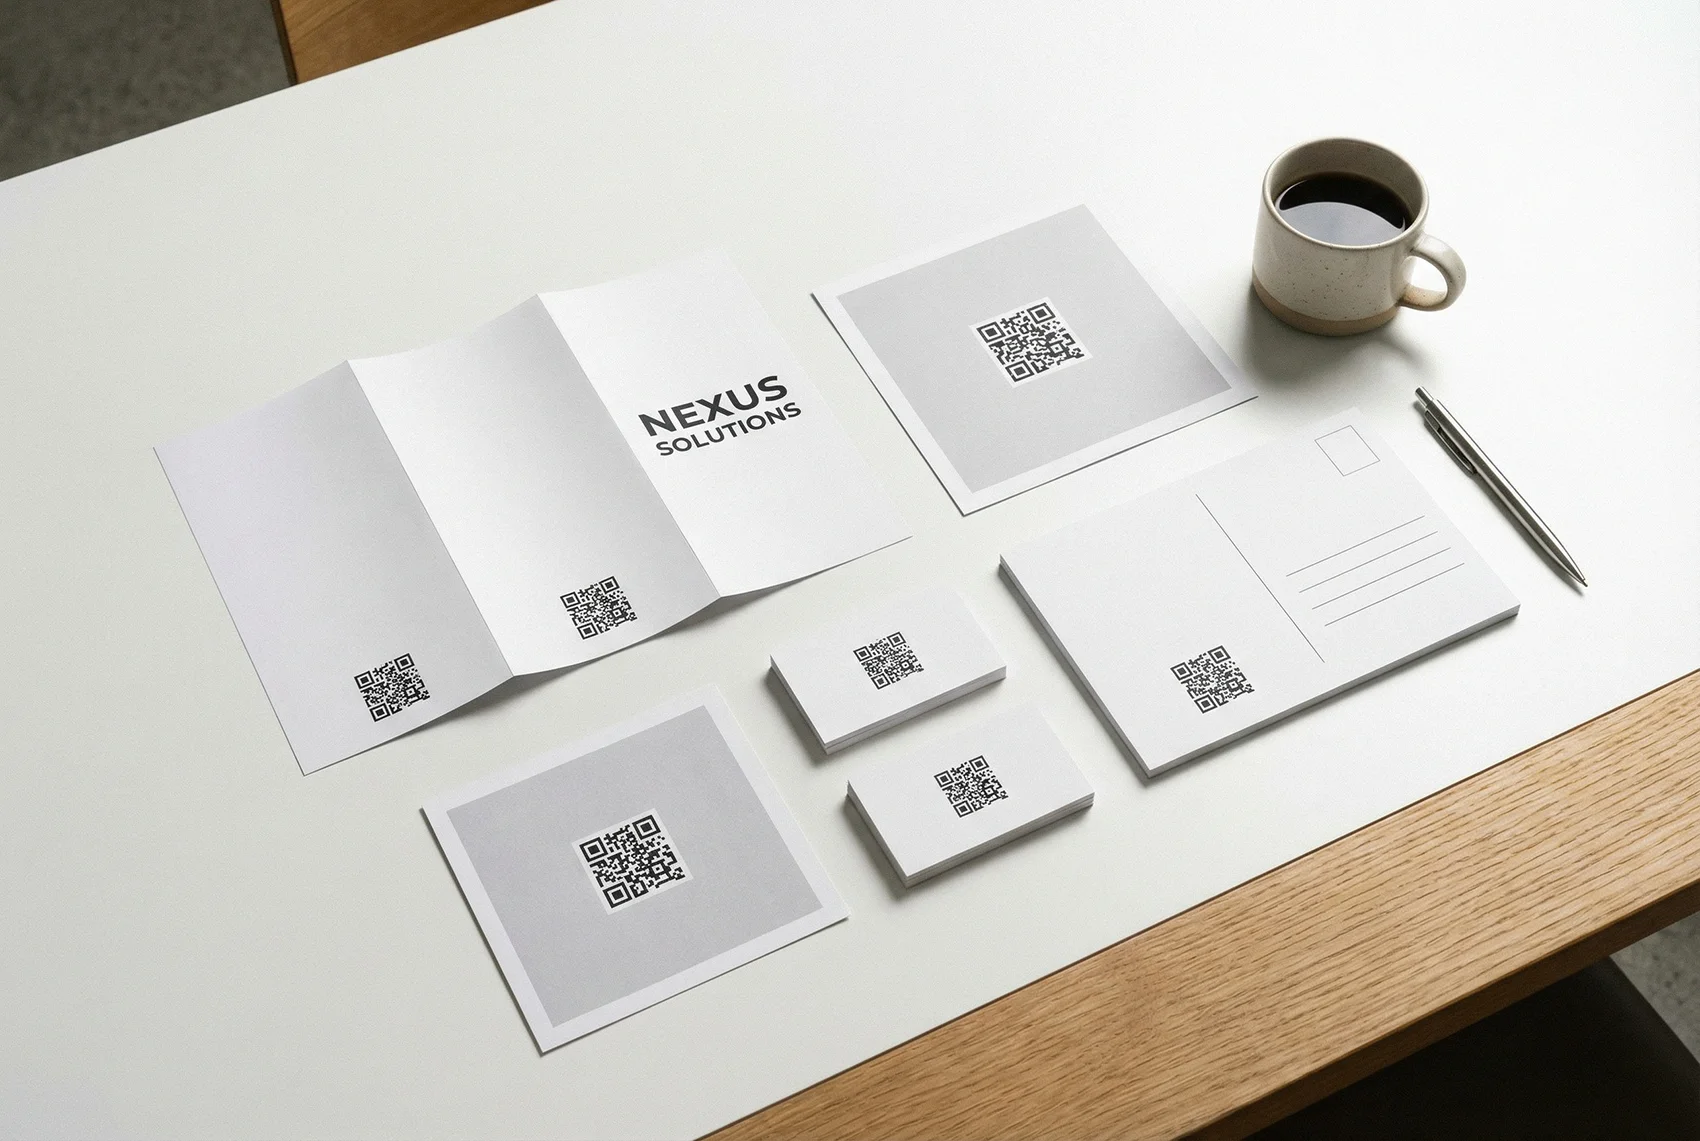
This works on anything you print: postcards, flyers, brochures, business cards, yard signs, door hangers, menus, product inserts, trade show banners, vehicle wraps — if it has a surface, you can put a QR code on it.
What "tracking" actually means
When we say tracked QR codes, we don't mean vague traffic numbers. Every scan records specific data points you can use to evaluate your campaign.
Scan count. The most basic metric — how many times was this code scanned? If you printed 5,000 flyers and got 47 scans, that's a 0.9% engagement rate. Now you have a number to compare against your next campaign.
Unique visitors. Total scans includes repeat scanners. Unique visitors tells you how many different people engaged. If you have 47 scans from 31 unique IPs, some people came back more than once — which might mean your offer was interesting enough to revisit.
Location. City-level geolocation for each scan. This is critical if you're distributing print materials across multiple areas. You might discover that the flyers you dropped in the Heights neighborhood are outperforming the ones downtown by 3x. That changes where you spend next month.
Device and browser. Knowing that 80% of your scans come from iPhones running Safari tells you exactly what to optimize your landing page for. If your page doesn't load well on mobile Safari, you're losing the majority of people who actually engaged with your print.
Timestamp. When are people scanning? If your restaurant table tent QR code gets scanned mostly between 11:30 AM and 1 PM, your lunch crowd is engaging but your dinner crowd isn't. Maybe the lighting at dinner makes it harder to scan, or maybe dinner guests aren't interested in the same offer.
Export to CSV. Pull all of this data into a spreadsheet for deeper analysis or to include in a client report. This matters if you're an agency managing campaigns for other businesses — you need to show results, not just say "we think it worked."
One QR code per campaign, or one per location?
This is the decision that makes or breaks your tracking strategy.
If you use the same QR code on every flyer in every location, you'll know total scans but you won't know which location drove them. If you create a separate QR code for each location, each has its own analytics. You'll see exactly which neighborhoods, stores, or events are generating engagement.
The same applies to different campaigns. Running a spring sale and a summer sale? Use different QR codes for each so you can compare performance side by side.
The tradeoff is management — more QR codes means more to keep track of. But if you're spending real money on print, the data is worth it. A dashboard that shows you "Downtown: 89 scans, Suburbs: 12 scans" changes how you allocate your next print budget.
The redirect advantage
Dynamic QR codes don't just track — they redirect. The QR code points to a tracking URL, which then sends the scanner to your destination page. That means you can change where the code goes after it's already printed.
This solves three problems that plague print marketing:
Typos. You printed 10,000 brochures and the URL is wrong. With a static QR code, you reprint. With a dynamic QR code, you fix the destination in 10 seconds from your dashboard.
Expired campaigns. Your spring promotion ended. The flyers are still circulating. Instead of sending people to a dead offer page, redirect the QR code to your current promotion. The same printed piece keeps working.
A/B testing. Send half your mailers to one landing page and half to another. Compare conversion rates. Then redirect the losing QR code to the winning page. You just optimized a print campaign — something most marketers think is impossible.
What about UTM parameters?
You could put UTM-tagged URLs in your QR codes and track everything through Google Analytics. Some marketers do this. It works, but it has downsides.
First, you're mixing QR scan data with all your other web traffic. You have to set up filters and segments in GA just to isolate scans. Second, UTM parameters make URLs long and ugly — not a problem if they're behind a QR code, but it's more complexity to manage. Third, GA doesn't give you scan-specific data like device type at the point of scan (it gives you device data for the page visit, which might not be the same if they scanned and then forwarded the link).
Built-in QR tracking gives you a dedicated dashboard with scan-only data. No filtering, no segments, no mixing channels. If you're already comfortable with GA and UTM workflows, keep using them. But if you want something simpler that just works, QR code tracking is the faster path.
Real numbers to expect
Print marketing QR code scan rates vary, but here are some ballpark figures to set realistic expectations:
Direct mail: 1–3% scan rate is typical. If you mail 5,000 postcards, expect 50 to 150 scans. That might sound low, but compare it to the 0% tracking you had before.
In-store signage: Higher engagement because people are already in your space. 5–15% of people who see the sign may scan.
Trade show handouts: 10–20% if your booth traffic is targeted. Conference attendees are actively looking for solutions.
Product packaging: Varies wildly — 2% for general consumer products, up to 30% for tech products where people need setup instructions.
The point isn't that these numbers are high or low. The point is that you have them. And once you have a baseline, you can improve it — test different placements, different calls to action, different offers, and watch the scan numbers change.
How to get started
You don't need to overhaul your entire print workflow. Start with one piece.
- Create a free account on QR Code Better
- Create a dynamic QR code pointed at your landing page or offer
- Download it as PNG or SVG
- Add it to your next print piece — flyer, postcard, business card, whatever you're already producing
- Check your analytics after a week
That first campaign will tell you more about your print marketing ROI than the last five years of guessing. And it takes about three minutes to set up.
Start your free trial — 5 dynamic QR codes included, full analytics, no credit card required.