QR Code Scan Analytics
Know exactly when and where your QR codes get scanned. Track every scan with detailed location, device, and timing data.
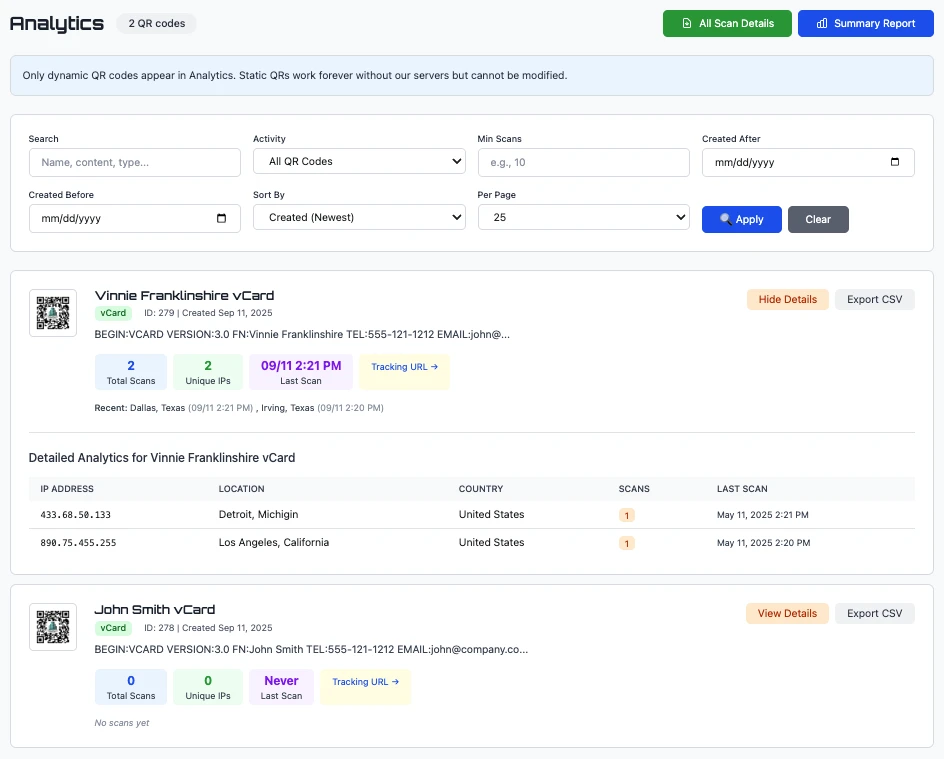
Real analytics dashboard showing scan data by location, IP, and time
What You See For Every QR Code
Total Scans
Complete count of every time your QR code was scanned. Watch the number grow as your campaign spreads.
Unique IPs
See how many different people scanned your code. Helps distinguish reach from repeat scans.
Last Scan Time
Know exactly when your most recent scan happened. See if your QR code is still actively being used.
Scan Locations
City, state, and country for every scan. See exactly where in the world your QR codes are being used.
Detailed Scan Breakdown
Click "View Details" on any QR code to see the complete scan history:
| IP Address | Location | Country | Scans | Last Scan |
|---|---|---|---|---|
| 433.68.50.133 | Detroit, Michigan | United States | 1 | May 11, 2025 2:21 PM |
| 898.75.455.255 | Los Angeles, California | United States | 1 | May 11, 2025 2:20 PM |
Export any QR code's complete scan history to CSV for your own records or reporting.
Every Scan Captures
Device Type
Mobile, tablet, or desktop
Browser
Chrome, Safari, Firefox, etc.
Operating System
iOS, Android, Windows, Mac
Time of Day
Hour and minute of scan
Day of Week
Spot weekly patterns
City & Country
Geographic location data
Why Scan Analytics Matter
Prove Your Marketing Works
Show stakeholders exactly how many people engaged with your flyers, posters, or packaging.
Compare Placements
Use different QR codes for different locations. See which spots get the most scans.
Discover Your Audience
Learn where your scanners are located. Find unexpected markets or verify expected ones.
Spot Timing Trends
See when people scan most. A restaurant menu QR spiking at noon confirms lunch traffic.
Start Tracking Your Scans
Create a dynamic QR code and watch the analytics roll in. See who's scanning, where, and when.
Create Trackable QR CodeFree trial includes full analytics • No credit card required
📊 Analytics Require Dynamic QR Codes
Static QR codes encode the destination URL directly and can't be tracked. Dynamic QR codes route through our servers, capturing scan data before redirecting to your destination. All paid plans include dynamic QR codes with full analytics.